Recent papers in flowchart understanding with VLMs
Summaries of recent papers about flowchart-to-code task. Adapted from my knowledge sharing session at Continental-NTU Corplab.
This post does not contain my own research, just my takeaways from reading these papers.
Flowcharts
Flowcharts are documents that are most frequently used to depict the sequence of steps in a process. For example, the following flowchart is describing an algorithm to find the first occurence of a number within a sorted array. Image is from the FlowVQA dataset
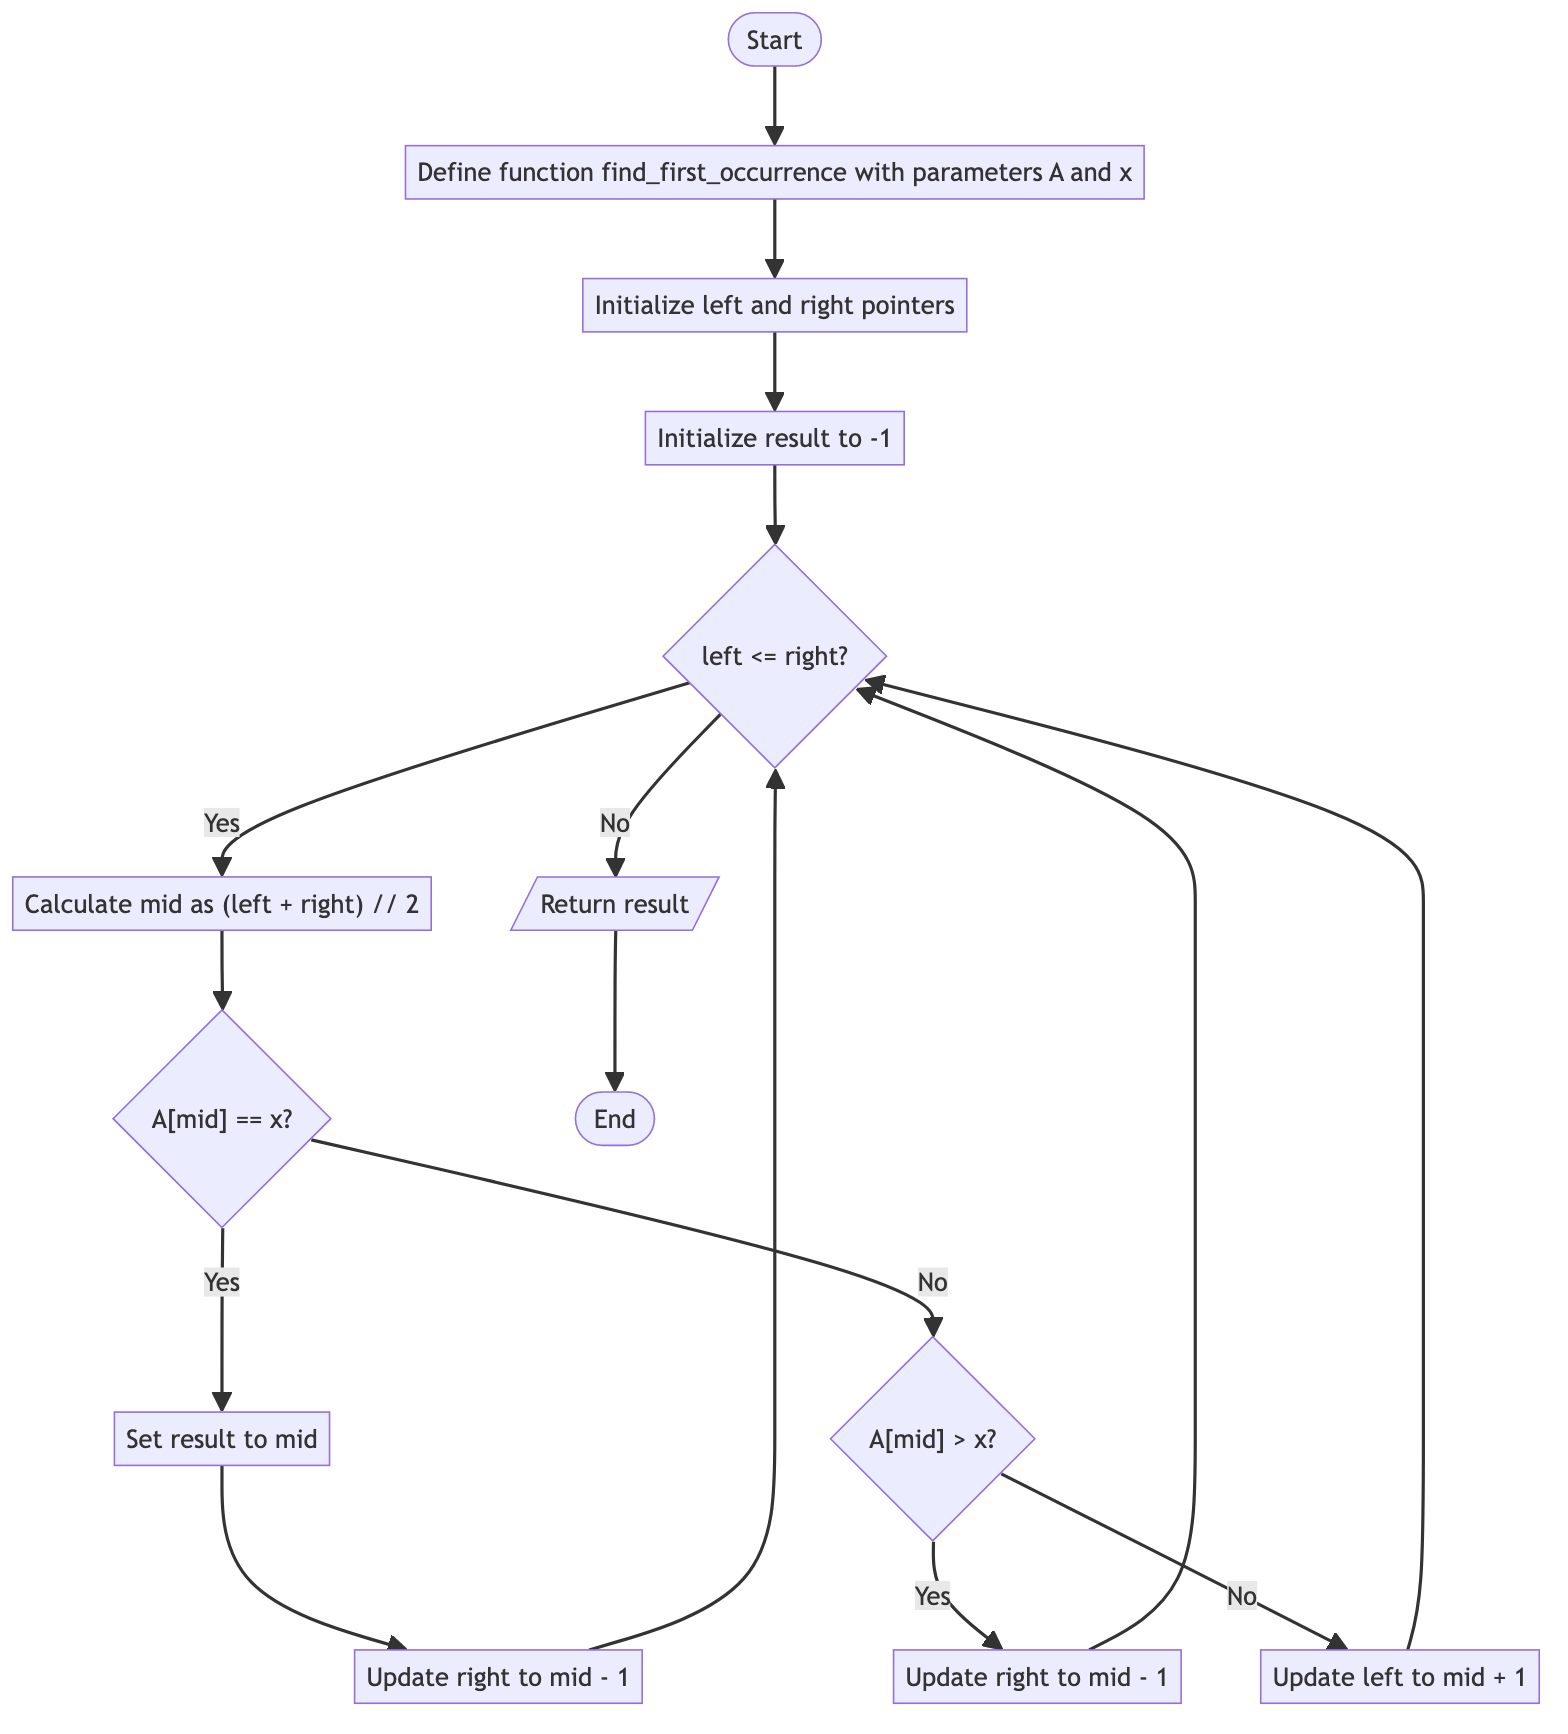
The elements of a flowchart can be thought of as nodes and edges, same as in a graph or network. Each node has a shape that defines its role (retangle for step, diamond for conditional, and so on) and a textual label. Each edge (or link) is usually a directed arrow that shows the flow of steps, and ocassionally has a label for the condition (e.g., Yes/ No). Simple enough for the human eyes, but infinitely tricky for the machine.
Vision-language models (VLMs) – such as GPT-4o, Claude 3.7 Sonnet, Qwen-2.5-VL – are AI models that can take in both image and text as input. They provide a promising venue for automated analytical tasks regarding flowchart images.
Flowchart Visual Question Answering
One popular research direction is flowchart Visual Question Answering (VQA). For example, you might ask the VLM questions like:
- “What happens to the ‘right’ pointer when the search element ‘x’ is found at the ‘mid’ index?”
- “How many nodes exist in the given flowchart?”
- “Is the node ""Update left to mid + 1"" direct predecessor of the node ""left <= right?""?”
This topic has been covered in papers such as: FlowVQA
Some papers suggest that the inherent complexity of flowcharts (i.e., to truly understand the visuals of relations between nodes in the image) is the key challenge for VLMs. A recent paper by
Flowchart Image-to-Code
Another research direction that has just received attention very recently is the task of converting flowchart images to code (image-to-flow, flowchart-to-code). “Code” here means diagramming languages – such as Mermaid, Graphviz, TikZ, etc. – that programmatically defines the elements in a flowchart image. For example, this is the original Mermaid code that creates the flowchart at the start.
flowchart TD
    A(["Start"]) --> B["Define function find_first_occurrence with parameters A and x"]
    B --> C["Initialize left and right pointers"]
    C --> D["Initialize result to -1"]
    D --> E{"left <= right?"}
    E -->|"Yes"| F["Calculate mid as (left + right) // 2"]
    F --> G{"A[mid] == x?"}
    G -->|"Yes"| H["Set result to mid"]
    H --> I["Update right to mid - 1"]
    I --> E
    G -->|"No"| J{"A[mid] > x?"}
    J -->|"Yes"| K["Update right to mid - 1"]
    K --> E
    J -->|"No"| L["Update left to mid + 1"]
    L --> E
    E -->|"No"| M[/"Return result"/]
    M --> N(["End"])
You can input the image into a VLM and prompt it to generate the Mermaid code. For example, this is the code generated by Qwen-2.5-VL-32B for the same image, which renders into a slightly different image but overall retains the correct flow.
flowchart TD
    A(["Start"]) --> B[/"Define function find_first_occurrence with parameters A and x"/]
    B --> C[/"Initialize left and right pointers"/]
    C --> D[/"Initialize result to -1"/]
    D --> E{"left <= right?"}
    E -->|No| F[/"Return result"/]
    F --> G(["End"])
    E -->|Yes| H[/"Calculate mid as (left + right) // 2"/]
    H --> I{"A[mid] == x?"}
    I -->|Yes| J[/"Set result to mid"/]
    J --> K[/"Update right to mid - 1"/]
    K --> E
    I -->|No| L{"A[mid] > x?"}
    L -->|Yes| M[/"Update right to mid - 1"/]
    M --> E
    L -->|No| N[/"Update left to mid + 1"/]
    N --> E
I am personally more interested in the flowchart-to-code task, because its code output can be used in more cases than simple VQA, such as for incorporation into RAG pipelines or performing auto-checking (i.e checking if a process is logically sound). The TextFlow paper actually explores using this code to improve performance in the flowchart VQA task (compared to using only image). Besides, my intuition is that it is easier for AI models to reason on text/code inputs than on visual inputs (which was also the intuition for the improvement in the Textflow paper).
However, findings in this topic are generally similar to flowchart VQA tasks, which is that VLMs can be useful for small and simple images, but massively underperform in more complex cases.
Recent advances
While working on the VLM topic, I came across some very recent papers (2 ICLR papers, 1 arXiv preprint, all in May 2025) that involve the flowchart understanding tasks. I will summarize what I found interesting/ applicable to my use case below.
BigDocs - Image2Flow (Rodriguez et al., 2025)
The BigDocs paper
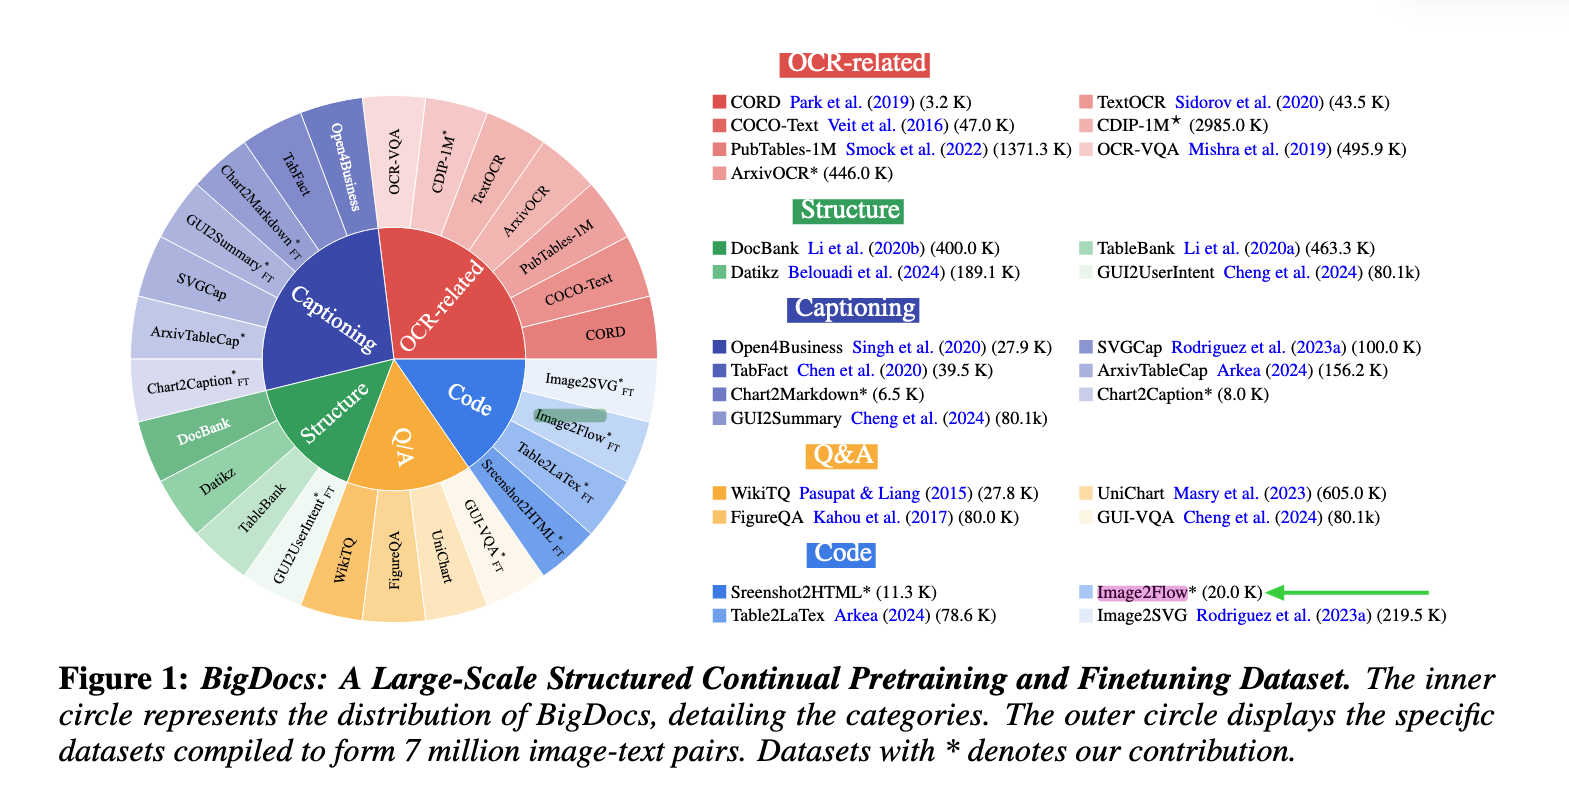
This paper is notable because it is one of the first to formally define “flowchart to code” as a task (they call it Image2Flow) and define a metric for benchmarking (they call it Length-Shape Triplet F1 score). Previous papers, like TextFlow, only considered it an intermediate step for VQA.
The findings that are relevant to me are as follows:
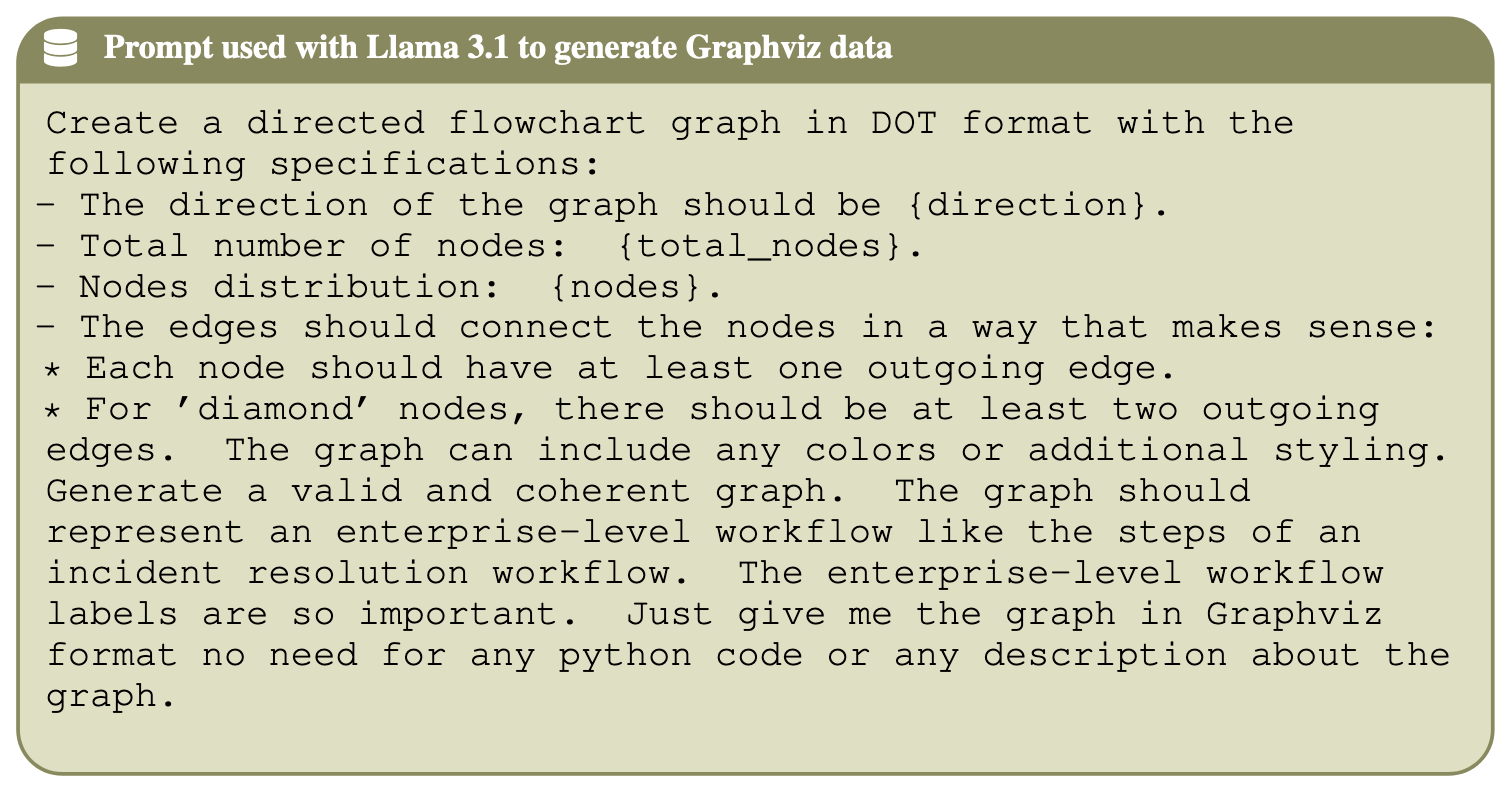
First, Image2Flow subset is created by asking an LLM (LLaMa 3.1) to generate GraphViz code/JSON for a flowchart, given some random parameters (such as number of nodes, their shapes, etc), plus some contraints to make it a plausible graph. The results is 10k pairs of image-GraphViz code plus 10k pairs of image-JSON (I count a total of 5 such datasets, including 2 shown here). It is also really interesting that the flowcharts are random and not real processes, which I’ll explain later.
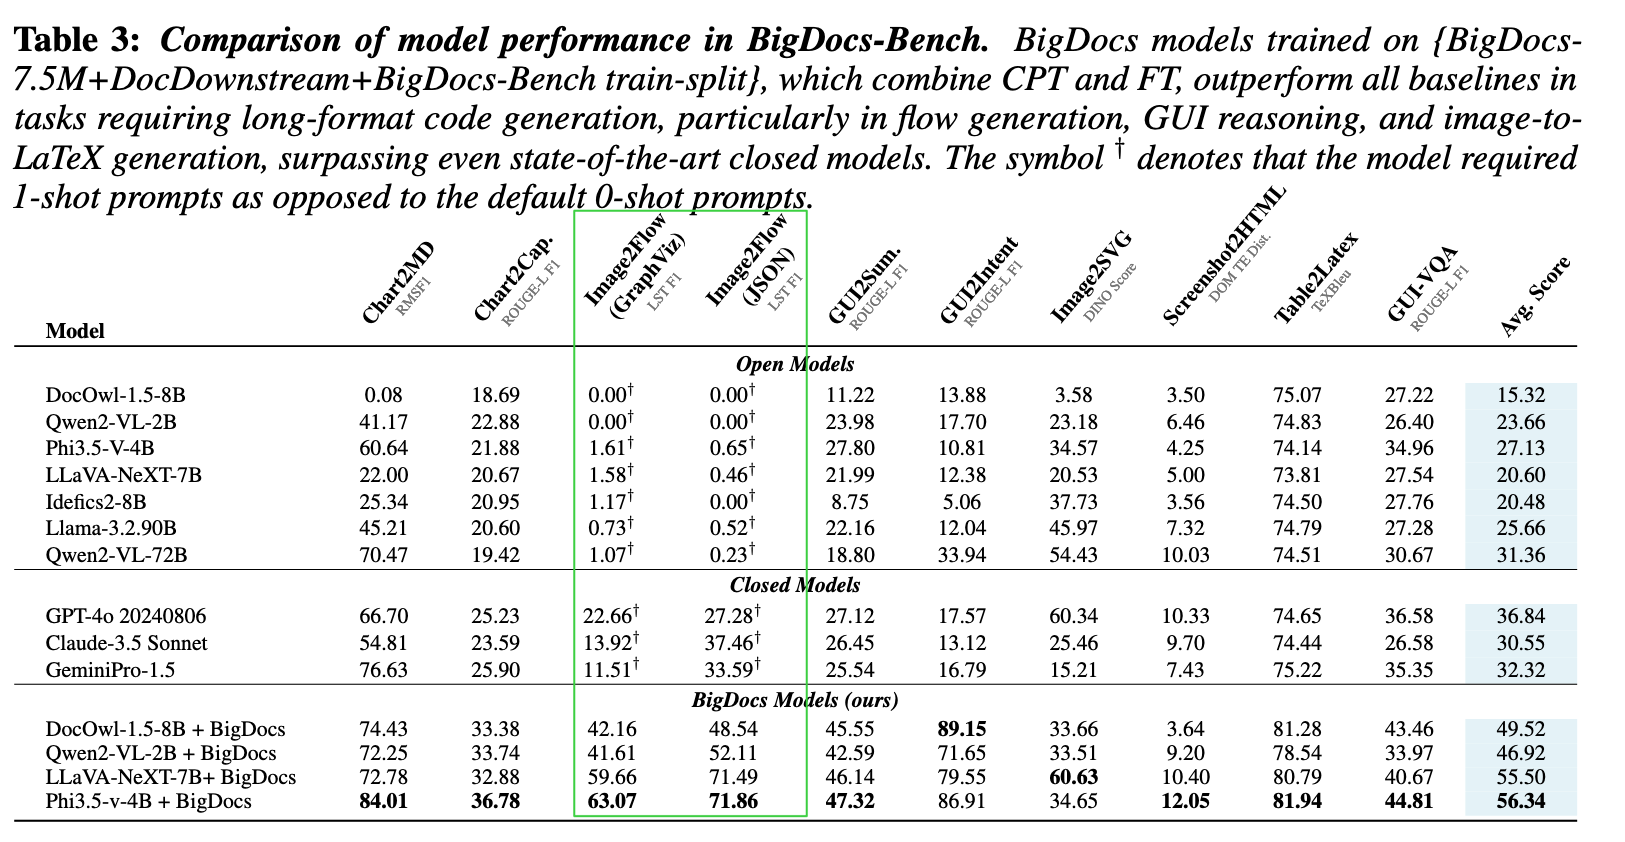
Second, the performance of the flowchart-to-code task is measured by Length-Shape Triplet F1 (LST F1), where the F1 score is calculated in the same way as in machine learning models, but on the flowchart “triplet” (s, e, d).
-
s,d: source and destination node’s text label and shape -
e: edge label
So the generated code is only “correct” if the information of the source node, edge, and destination matches exactly with that in the ground-truth code.
Third, they fine-tuned off-the-shelf VLMs with the BigDocs (whole dataset, not just the Image2Flow subset). This led to sigifincant performance gains in the flowchart-to-code task. For example, most open-source models (including big ones like Qwen2-VL-72B, Llama-3.2.90B) achieved near 0 F1-score for the GraphViz subset, while closed-source models (GPT4o, Claude 3.5) got aroun 10-20 (note that F1 scores range from 0 to 100). Whereas, with fine-tuning, even smaller models like Phi3.5-v-4B achieved up to 63 F1-score, showing huge performance gains. But then again 63 is not that high of an F1 score, this suggests area for further improvements.
This result, however, contradicts with an earlier finding from the TextFlow, where they also measured the flowchart-to-code performance using F1 scores (but for individual nodes and edges) on another dataset (FlowVQA). Notably, Qwen2-VL-72B, GPT-4o and Claude 3.5. Sonnet (same models as above) achieved very good F1 scores (90+).

What might cause this discrepancy? My guest guess is that it’s because the flowcharts in FlowLearn are real processes while Image2Flow contain fake ones, so the VLMs cannot use pre-learnt knowledge for reasoning – which, if true, is consistent with the findings from
Sketch2Diagram - Img2TikZ (Saito et al., 2025)
The Sketch2Diagram paper
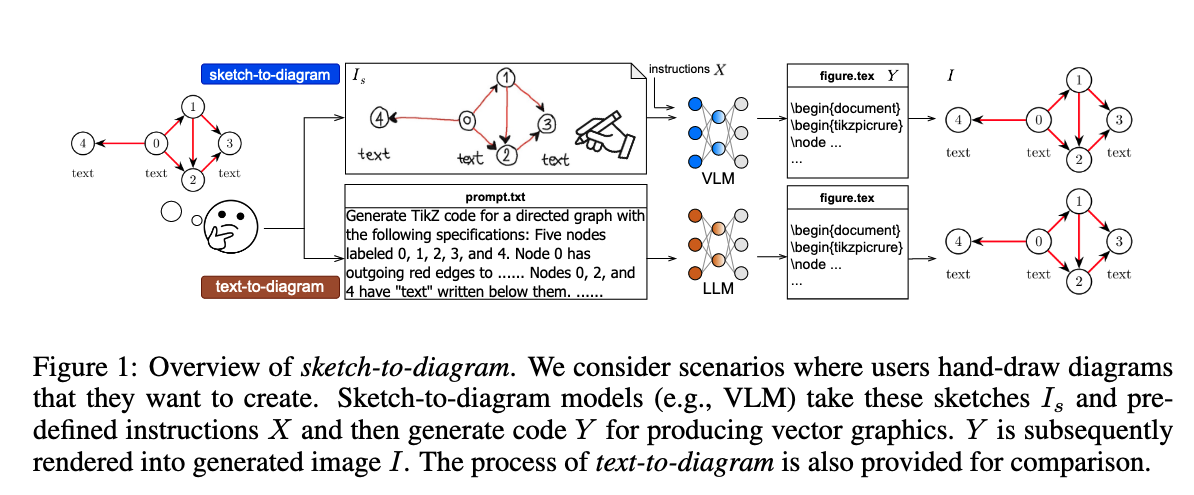
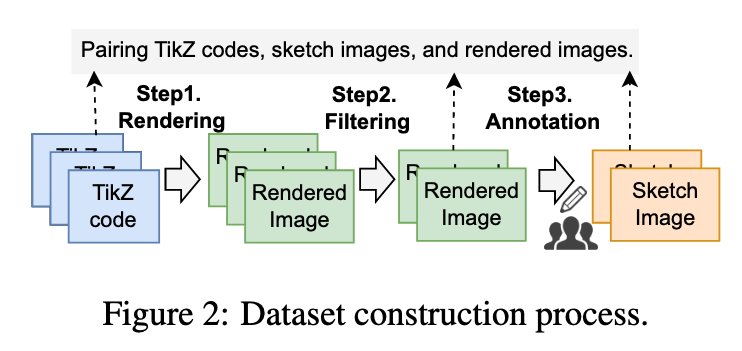
They first create SkeTikZ a dataset of 3k pairs of hand-drawn sketches with corresponding TikZ code (TikZ is another diagramming language, used in LaTeX documents). (They collect the TikZ source code first, render them, then hire humans to draw them on paper/whiteboard)
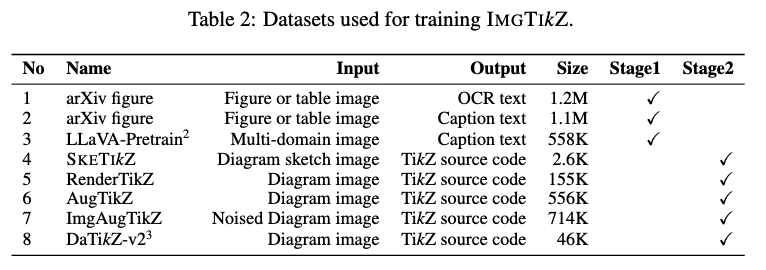
They then augment this dataset (adding noise, varying backgrounds and brightness, etc.) to be used as training data for their Img2TikZ model (similar to our flowchart-to-code task, but use TikZ).
They employ a 3-part architecture similar to LLaVA 1.5, but they switch out key components with different models:
- Vision encoder: use pre-trained SigLIP (vision language model similar to CLIP, but uses sigmoid loss)
- Adapter: trainable 2-layer multi-layer perceptron, same as LLaVA
- LLM: use pre-trained DeepSeekCoder for code output (instead of normal LLM for natural language0)
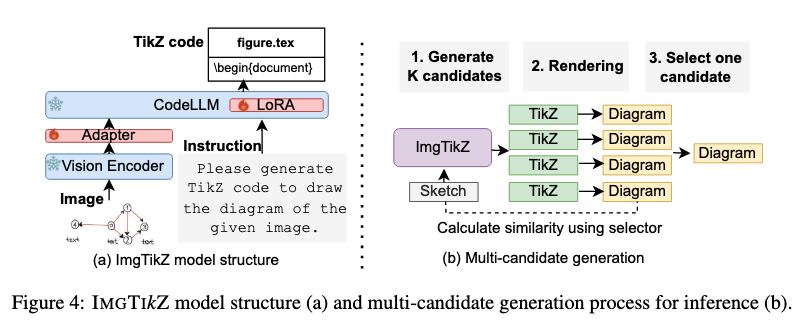
During training, they update the Adapter (stage 1) and Adapter & CodeLLM (stage 2) using the SkeTikZ dataset listed above. During inference, they use both iterative generation (IG - keeps generating 1 code version until it compiles) and multi-candidate generation (MCG - generate multiple code versions and uses another model to choose the best one as output). The model they use as selector for the MCG strategy is D-SigLIP (Diagram-Specialized SigLIP), which is the SigLIP with an additional layer that they fine-tune via contrastive learning, also using data from the SkeTikZ set.
For evaluation, they use both automatic metrics and human-annotated scores.
Automatic metrics include:
- Compilation success rate (CSR): whether the code can compile without error (if there’s syntax error, it will not compile)
- ImageSim: cosine similarity of rendered image vs ground-truth, with image embeddings by D-SigLip
- CodeSim: cosine similarity of output code vs ground-truth
- CharacterSim: Rouge-1 of OCR extracted texts of rendered image vs ground-truth
And for subjective, human judgement:
- Alignment: 1-5 human scores of alignment (1 = completely irrelevant)
- Quality: 1-5 human scores (1 = poorly arranged, unreadable, 5 = well-structured, logically arranged)
The results are as follows. Some notable points:
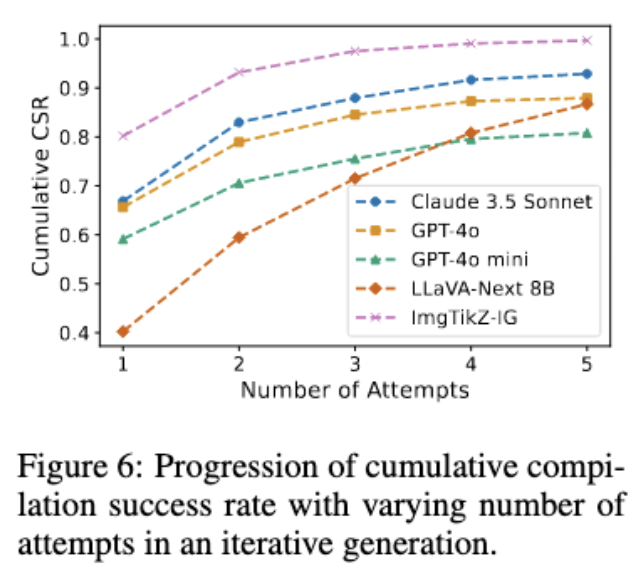
- Compilable code (CSR): Img2TikZ can generate compilable code (near 100% CSR after 5 attempts)
- Similar diagrams (ImageSim and Alignment): Best model (Claude 3.5) only achieves 3.32/5 alignment score, i.e: generated diagrams match only 50-60% of the reference diagrams, suggesting this is still an open challenge.
- Similar codes (CodeSim): Img2Tikz can generate code close to reference code (highest CodeSim). But, all models have high CodeSim, so similar code doesn’t guarantee quality image?
- High-quality diagrams: best model (Claude 3.5) only achieves 3.54/5, meaning models struggle with generating correct diagram layout.
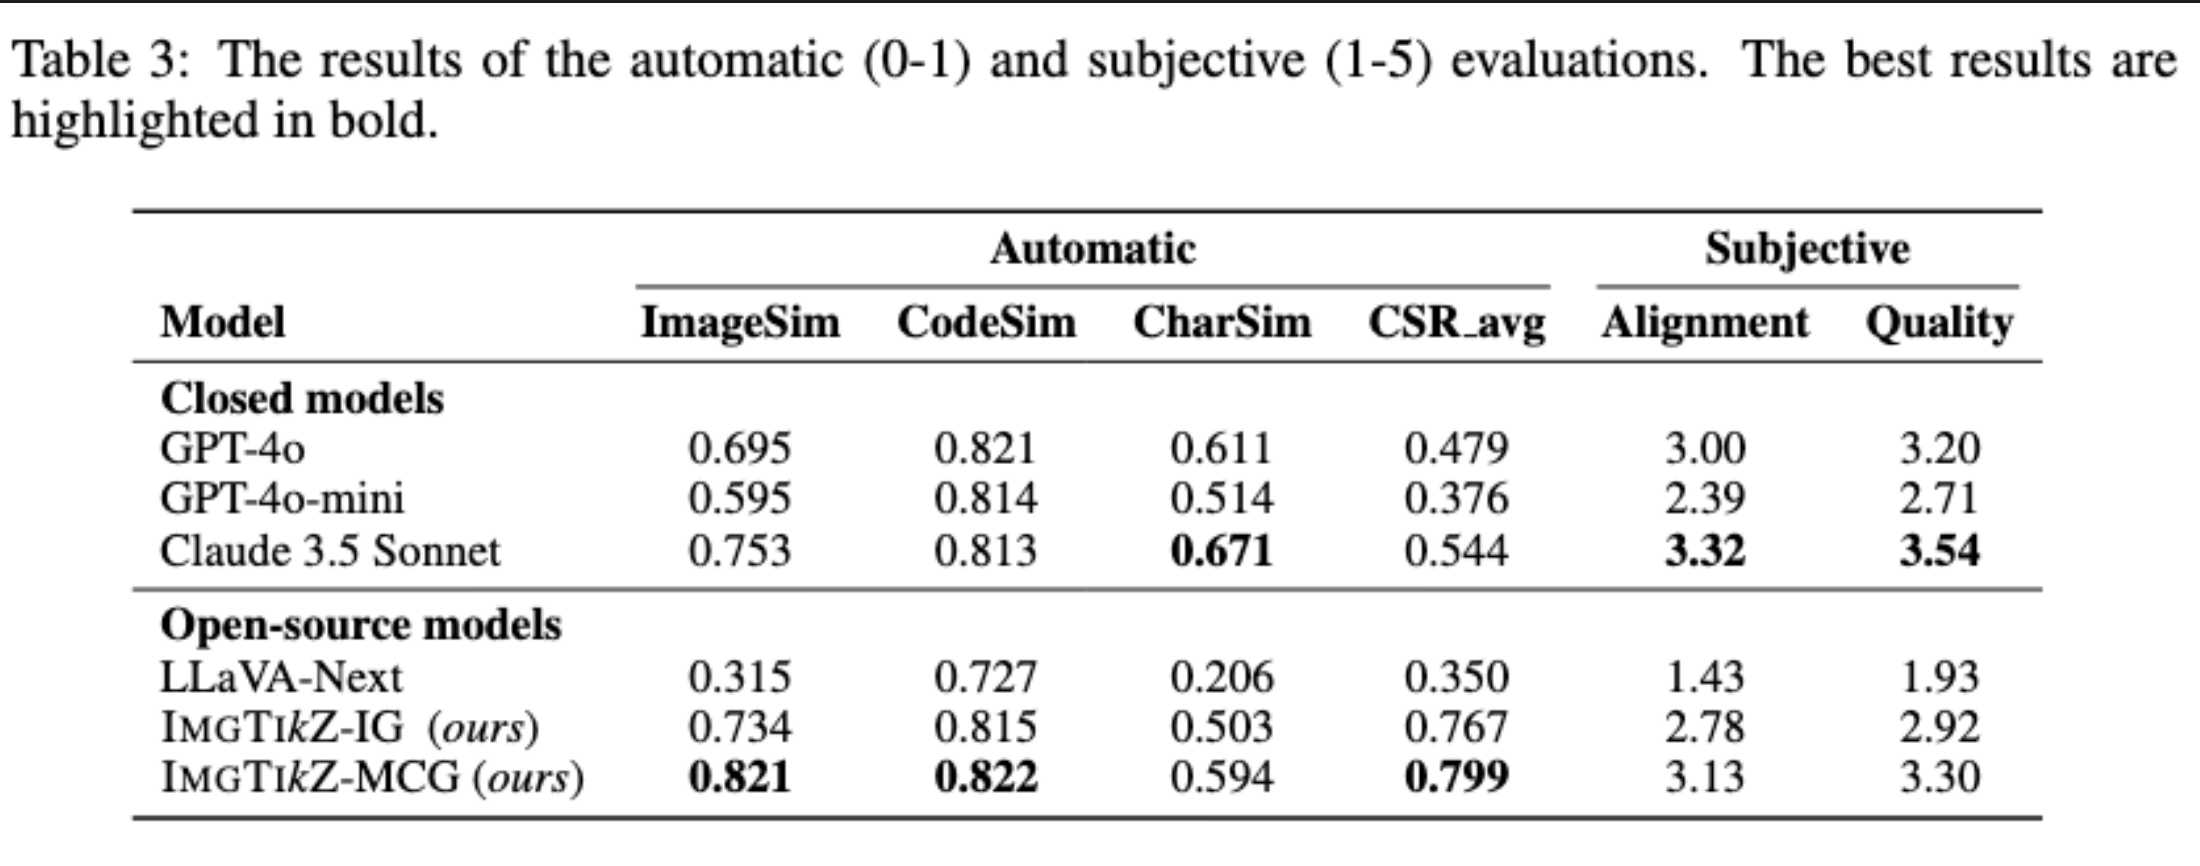
So overall, while models trained on diagram images performed better compared to off-the-shelf models, the output quality (as judged by humans) of even the best-performing VLMs still leave a lot to be desired. Not to mention, the new Img2TikZ models scored worse than Claude 3.5 in both human metrics.
As a bonus, they also analyzed the model performance when training with and without data augmentation pre-processing and found that the models with data augmentation perform better, suggesting (unsurprisingly) that augmentation can be an useful technique when dealing with visual data.
Arrow-guided VLM (Omasa et al., 2025)
The last paper I’ll cover proposes a very unique idea. Whereas previous papers relied solely on the image as input for the VLM, the Arrow-guided VLM paper
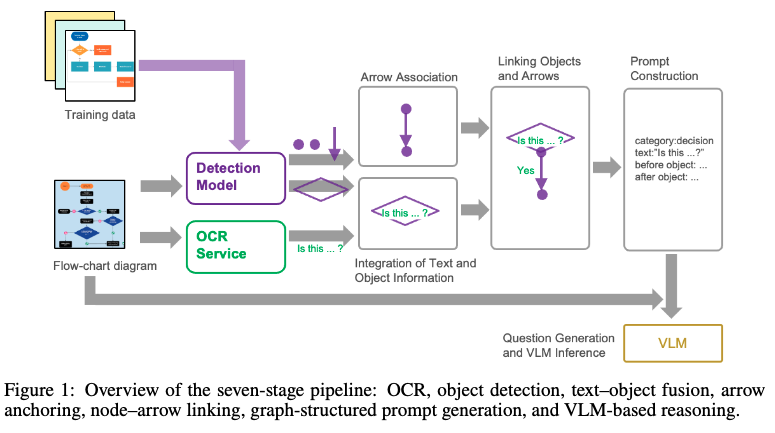
The idea is just as simple as it sounds:
- They use an existing OCR model (Azure AI Document Intelligence OCR) with a fine-tuned object detection model (DAMO-YOLO) specialized on shapes and arrows.
- They then use positional information from those models to “link” the different elements together (say, link a text with a box to form a node, or link an arrow to a certain node).
- This information is then fed into a VLM (GPT-4o) for question answering.
On the 90-question, 30-image dataset that they tested, this technique helped improve VQA accuracy (as judged by humans) significantly in most cases (see Ocr-Dec vs No-Ocr-Dec).


However, a shortcoming of this paper is that they only experimented with a very small and closed dataset (90 questions). They are also solving the VQA task, not the flowchart-to-code task per se. That said, I still think this idea may prove useful for a wide variety of flowchart understanding tasks.
Conclusion
So that is my takeaways after a few months of reading on the flowchart understanding topic. Do let me know if I get something wrong. The papers I mentioned can be found in the following reference section.